Engineering notes · 2026-09-20
What Five-Nines Reliability Really Takes
How controlled load testing exposed bottlenecks across a .NET service, Elasticsearch, Redis, and Kubernetes.
The goal seemed clear: scale a platform handling approximately 100 transactions per second to 1,000 TPS and beyond.
The hard part was nobody knew if the platform was able to do it.
The target was tied to a significant commercial opportunity. The business needed the platform to support 1,000 TPS with a p95 latency below 150 ms to support the potential onboarding of a large bank. If we could not demonstrate that capability, we risked losing the opportunity.
The acceptance criteria were more demanding than a throughput number: 1,000 TPS, p95 latency below 150 ms, zero errors, no pod restarts, average CPU below 90%, and average latency below 60 ms. That was 2022. Traffic came in with batch sizes from 1 to 200 items, and we were about to launch a new API that was going to require more processing power than the existing one. Availability was below 99.9%—the platform suffered from multiple outages in the six months since I joined the project. We had a production environment, a dotnet application running on Kubernetes, Redis and Elasticsearch as DataStores, application logs(ELK), Application Insights(APM) and AWS API Gateway access logs. What we didn’t have was a way to find out the most important thing:
What is the weakest point of the platform?
We thought the answer should have been in the application capacity. That was only half of the picture.
There was also a cost constraint. A full-scale AKS cluster with production-sized Redis and Kubernetes resources would have made repeated load testing expensive. The test environment needed to be representative enough to produce useful evidence, but temporary enough that we were not paying for it between tests.
The load test needed an operating model
We separated the workflow into two pipelines. One pipeline built and destroyed the test environment. It provisioned the AKS cluster and supporting services, then removed them after testing. The second pipeline ran the load test and recorded the result as a pass or fail.
The operator running a test owned the full lifecycle: build the cluster, run the test, capture the result and destroy the environment. That kept the workflow clear, but it also created an obvious operational risk. If the operator forgot the final step, the temporary environment could continue generating cost.
We added an alert for environments that remained active outside business hours. That turned a reminder into a cost-control guardrail.
The environment matched production in scale. That mattered because the purpose of the test was to make a capacity decision, not to produce an optimistic result from a miniature environment.
The cost difference was significant. A full-scale environment cost approximately USD 10,000 per month to run continuously. A 30-minute load test cost less than USD 20. The governance and teardown alert were working well, so adding more automation would have increased complexity without solving a demonstrated problem.
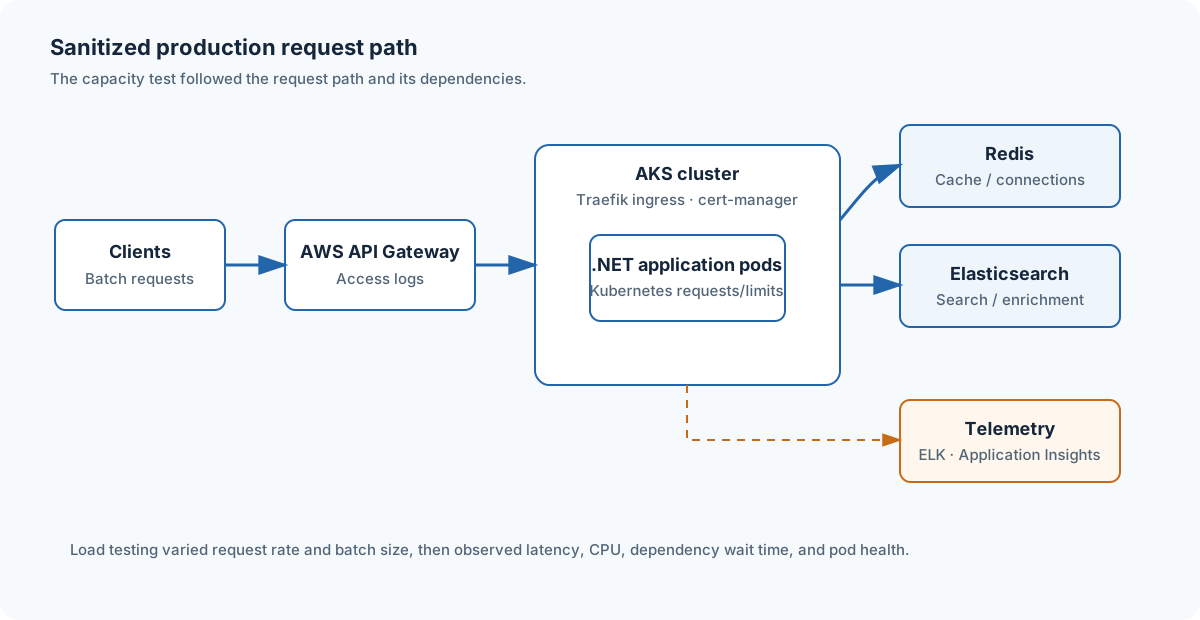
A simplified view of the request path and the dependencies involved in the capacity investigation.
The first limitation was the lack of a test
API Gateway access logging provided some insight into what traffic we had on the platform. With CloudWatch Logs Insights, it was possible to query request rates and latencies and understand production behavior of the system. But this was not enough to understand the safe capacity limit of the platform.
Observed traffic is not equal to tested capacity.
To discover it, we had to generate controlled traffic, vary batch sizes and run tests long enough for queues and dependent systems to surface. I built a load testing harness using Azure Load Testing and created a test script to generate JMeter test files for both APIs.
The traffic pattern was defined by AWS API Gateway access logs. The practical task was how to generate and sustain that traffic pattern long enough. I tuned JMeter thread and loop settings until the test was able to sustain 30 minutes of load. One burst may show the platform hitting a number. A sustained test will show if it can stay there.
Adding a pod did not add the capacity we wanted
The first significant limitation appeared at approximately 500 TPS. As CPU usage increased, latency started increasing rapidly. In the end, the liveness probes failed and application pods restarted.
Our natural reaction was to follow the obvious path—add another node and another pod.
The expected result was not achieved.
Adding pods had worked for us in the past, but I had warned that the relationship would not remain linear at higher load. The test confirmed that hypothesis. More replicas could increase capacity up to the point where a dependency became the constraint; after that, adding pods only increased waiting and contention.
That changed the direction of the investigation. If additional application capacity doesn’t increase the throughput, the application tier must be waiting for something else.
Telemetry data from the load test showed that wait times in Elasticsearch were increasing and its CPU usage was approaching 100%. The search tier became the limiting factor. Application replicas could not make a saturated dependency process requests more quickly.
We doubled the number of cores of the Elasticsearch VM and ran the test again.
The result improved, but only up to 700 TPS.
The bottleneck returned to the application
At 700 TPS, the platform was still below the 1,000 TPS requirement. The next issue was found in the application’s ability to process larger batches under higher traffic.
It wasn’t visible at the initial traffic level. It surfaced with the combination of increased request rate and batch size.
The application team was able to investigate and fix the processing issue. After the change, the platform achieved the 1,000 TPS requirement.
It was easy to consider it an endpoint and the work as done. The test passed the goal number. The sustained load test wasn’t finished with us yet.
Fifteen minutes later, Redis became the problem
After approximately 15 minutes of sustained load testing, Redis connection failures started appearing in Kibana. The application worker-thread setting was exhausted. It caused liveness failures and another restart cycle of the application pods.
It was a different limitation from the previous Elasticsearch saturation problem. The platform was able to reach the target rate, but it couldn’t sustain the conditions yet.
The solution included three related changes: the development team changed the StackExchange.Redis library, enabled its async capabilities, and I found a worker-thread value that worked with the Kubernetes resource requests and limits. The worker-thread value was supplied as a variable during the Helm upgrade.
The number itself was not the lesson. A thread setting that looks acceptable in isolation may not be suitable for the CPU limits of a container, the Redis client library and the way the application works.
The capacity number was only a starting point
Eventually, the platform reached the required 1,000 TPS rate. Much more importantly, the investigation revealed our understanding of capacity.
The limiting factor shifted as we changed the system: first it was the application CPU usage and liveness behavior, then Elasticsearch saturation, then application batch processing and finally Redis connectivity and exhaustion of the worker-thread setting.
The platform was not a single component with a single capacity number. It was a request path with multiple limiting factors.
That’s why an additional pod wasn’t the capacity plan. The capacity test needed realistic batch sizes, representative traffic, telemetry of the dependent systems and enough time to expose saturation, queue growth, thread exhaustion and recovery behavior.
At 1,000 TPS, p95 latency was 100 ms, the error rate was zero, the environment remained stable for the full 30-minute run, and there were no pod restarts. Average latency remained below 60 ms and average CPU stayed below 90%. We also tested to 1,500 TPS to understand the headroom beyond the immediate requirement.
| Measure | Before the work | After the work |
|---|---|---|
| Sustained throughput | Approximately 100 TPS baseline | 1,000 TPS accepted; tested to 1,500 TPS |
| p95 latency at target load | Not established | 100 ms |
| Average latency | Not established | Below 60 ms |
| Error rate | Not established under sustained target load | Zero |
| Pod restarts | Liveness failures under pressure | None during the 30-minute target run |
| Average CPU | Not established at target load | Below 90% |
| Full-scale environment cost | Approximately USD 10,000 per month | Less than USD 20 for a 30-minute load test |
My scope was the infrastructure and test system: the pipelines, ephemeral environment, load-test harness, traffic model and telemetry. When the tests exposed application-processing issues, I asked the development team to investigate those changes. Keeping that boundary clear allowed each team to work at the layer it owned while we continued to reason about the platform as a whole.
Lessons that I learned were very straightforward:
- Measure the system you have before designing the system you want to build.
- Test dependencies as part of the platform; application replicas can’t hide a saturated search or cache tier.
- Separate the sustained load test from a successful burst.
- Take into account resource limits, client libraries, asynchronous processing and health probes together.
- Capacity belongs to the whole request path, not to a single Kubernetes deployment.
Sustained testing was essential because some failures only appeared under a higher-pressure profile. A platform can reach a target number and still fail after the queues grow, a dependency saturates, or a worker pool is exhausted.
This was only one step in our reliability journey. Five-nines availability wasn’t achieved with one scaling decision. It was the result of discovering the place where our assumptions didn’t match production reality and changing the system and its measurement together.